Get a Unique Edge on Trading with the Footprint® Chart from MarketDelta Trader.


Stay on top of any market condition price and volume like never before.
The revolutionary Footprint chart sits at the intersection of design and market transparency and displays price AND volume activity with added color shading to signify the dominant order flow – allowing you to see market imbalances the moment they occur.
With one of the industry's most powerful and unique visual tools it's only fitting to power it with nothing less than OEC Trader's lightening-fast and accurate execution infrastructure.
Don't miss this opportunity to give your online trading an edge.
Additional Features Include:
- Increased transparency
- Unique market view
- One-click Execution
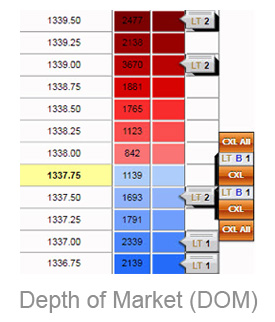
- Depth of Market (DOM)
- Price Ladder

About MarketDelta
Located in Chicago, MarketDelta® LLC is a leading provider of charting, trading, and financial data visualization software. The company began in 2003 at the Chicago Mercantile Exchange by traders who wanted greater transparency and better tools to trade by. Today the company has grown into a leader serving traders, proprietary trading groups, hedge funds, banks, and investors around the globe through our innovative suite of products.
Get Started with a Free Simulated Account
Please complete the fields below. Fields marked with an asterisk (*) are required.
